What to do with this activity?
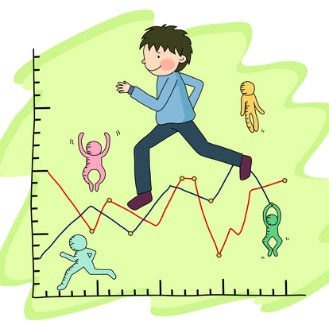
A line graphic is a simple way of showing, on a picture, how things change over a period of time. The bottom line (or axis) which is horizontal (like the horizon) shows the time periods you are measuring. The other axis is at right angles, vertical and on the left of the page. It represents the thing that is changing and that you want to measure.
For instance, if you wanted to compare the outside temperature on different days of the week you would put the days of the week along the bottom, and the temperature on the vertical line. The temperature on each day is marked as a point, and then joined with straight lines to make an easy to read line graph.
Let your child have some fun with these online games from IXL that will give them a bit of practice in reading and understanding line graphs. And here are some exercises to practise creating line graphs from information provided.
-
Why am I doing this?
Maths makes sense to children when they use it in everyday life - like measuring things, working out distances, estimating food for dinner or money for groceries. The more opportunities you give your child to use the maths they learn at school through everyday activities the more they will understand and enjoy working with numbers.
-
How can I do more?
Discuss maths that you see around you. For example, talk about sales in shops – half price, 25% off, what is good value? Or how much will the item cost after the discount?
Rate this activity
![]()
![]()
![]()
![]()
![]()
Based on 32 reviews
How would you rate it?
1 = Poor, 5 = Great.
Share this activity
If you’ve found this activity helpful, why not share it with your friends?

